Lactate Testing — Part II: LT2
Recap
Part I established that breath frequency is not a useful marker for \(\text{LT}_1\): it stays approximately constant across a wide range of intensities that straddles the first lactate threshold, with the body meeting rising oxygen demand through deeper breaths rather than faster ones. The key take-away was that one cannot trust breathing cadence to gauge \(\text{LT}_1\); while the required increase in oxygen intake is facilitated by progressively increasing tidal volume, the more useful signal turned out to be the desire to exhale — a subjective but physiologically grounded sensation tied to rising \(\text{CO}_2\) levels.
But does the same hold true for \(\text{LT}_2\)? Interestingly, it appears not to be the case.
Three stages of breathing
The onset of \(\text{LT}_2\) in my test appears to coincide surprisingly well with a significant inflection in breath frequency. Breaking breath frequency into three segments — each relatively well fitted with a straight line, and excluding a couple of artifacts (the settling period at the start, and the clear glitch in the 1000–1150 s range) — three very clear stages are revealed.
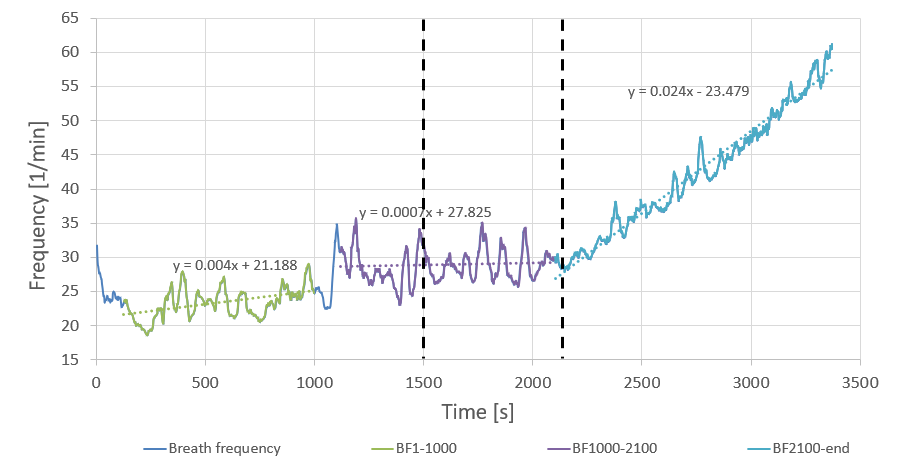
Stage 1 — as power increases but remains within the recovery/Z1 zones, breath frequency is low and increases gradually. This kind of load does not necessitate chaining in- and ex-hales in continuous back-to-back fashion; the workload is mild enough for there to be a split-second gap between individual breaths, and as load increases this gap becomes progressively smaller.
Stage 2 — once the gap is reduced to zero, breath frequency stabilises. As we discovered in Part I, the extra oxygen demand is serviced by increased breath volume. This all happens largely automatically, without participation of conscious thought, all the way until \(\text{LT}_1\). Once \(\text{LT}_1\) is attained and surpassed, the process becomes more deliberate. I believe this deliberate effort to be associated with two factors.
Firstly, as discussed in Part I, there is the impossible-to-ignore build-up of \(\text{CO}_2\) associated with \(\text{LT}_1\). Secondly, while increasing the volume inhaled in each breath, eventually one reaches a point where the volume is such that one starts working beyond the ‘neutral’ holding capacity of the chest cavity — in other words, one inhales so deeply as to feel the ribs squeezing the air back out. Try taking a really deep breath and then holding it: there is an amount of pressure to be held back if the air is to be kept in. When not under load, we rarely operate in that regime, and doing so requires some conscious effort. This stage of breathing is of course tightly coupled with the \(\text{CO}_2\) build-up and is another hallmark of \(\text{LT}_1\).
To reiterate: in Stage 1 we operated within the ‘neutral’ lung capacity, without excessively ‘packing’ the lungs to a point where it becomes a conscious, deliberate effort — let us say within a 20%–80% usable lung volume range (a handy reference only, not a claim on actual numbers). In the latter stages of Stage 1 and into Stage 2 (but before \(\text{LT}_1\)), there is some trading between breath volume and frequency, resulting in a net increase in total gas exchange in order to service the increased oxygen demand. From around \(\text{LT}_1\), lung volume utilisation increases once more, heading towards the full 5%–95% range. (Using 0%–100% didn’t feel right: even after having taken an enormous gulp of air in one go, it’s still possible to ‘pack’ more air by holding the initial gulp and forcing further smaller gulps — a technique used in freediving.) Perhaps somewhere around the 10%–90% level this lung ‘packing’ becomes very conscious and deliberate as we venture beyond \(\text{LT}_1\) but haven’t yet reached \(\text{LT}_2\).
Stage 3 — as load is increased further, the limit of what can be achieved in terms of oxygen intake by increasing breath volume is reached, and Stage 3 begins. As can be seen from the data, two things happen simultaneously at around 2200 s: individual breath volume peaks, and breath frequency increases sharply. A linear fit for Stage 3 of breath frequency has 35 times the gradient of Stage 2. Moreover, both of those discrete events coincide very closely with the \(\text{LT}_2\) estimated from the lactate data.
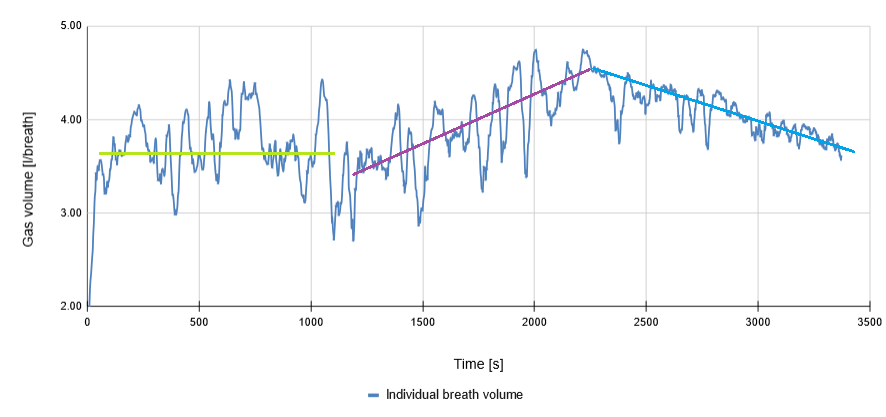
Rather interestingly, breath volume drops somewhat in the 1000–1500 s range (though the individual breath volume data is quite noisy). In Stage 3 the breath frequency increases once more, and we depart from the 5%–95% lung volume utilisation. The reasoning behind the decreased breath volume is two-fold: by clipping the inhale and exhale short, we get to the next batch of fresh, more highly concentrated oxygen quicker, while also discarding the part of the breath cycle during which we have to work against the natural elasticity of the chest cavity.
The heuristic
I have previously associated \(\text{LT}_1\) with the first onset of the desire to exhale — to get the \(\text{CO}_2\) out. In contrast, for \(\text{LT}_2\), while the urge to get the \(\text{CO}_2\) out is quite obviously still there, the subjective perception shifts to that of gasping for air — I no longer think about exhaling the \(\text{CO}_2\); the front-and-centre of my attention is to get to the next batch of oxygen.
In conclusion, \(\text{LT}_2\) appears to be well correlated with the onset of ‘clipped’ breathing. If it is no longer possible to supply sufficient oxygen while retaining full-depth breathing, and we become forced to discard the less productive stages of each breath cycle, chances are we have just crossed \(\text{LT}_2\). Backing off from that point until full-depth breathing becomes sustainable again should serve as a reasonably accurate means of estimating \(\text{LT}_2\).
Being tied to a fairly objective metric such as breathing cadence makes estimating \(\text{LT}_2\) a great deal easier compared to the largely perceived feature devised for \(\text{LT}_1\).